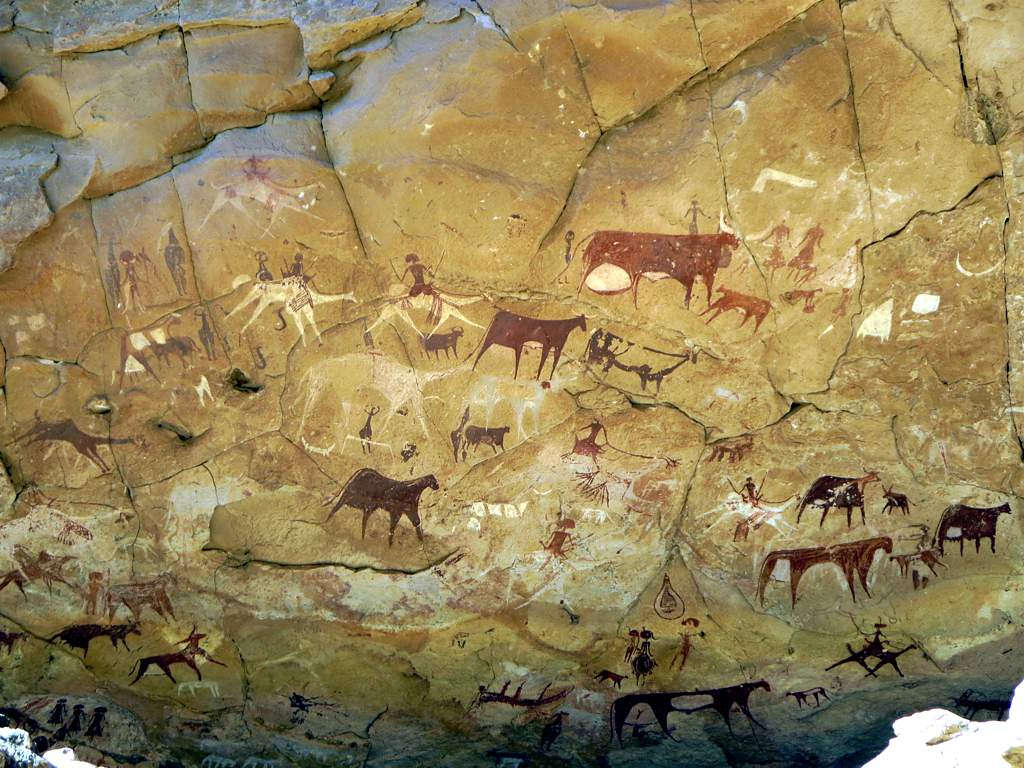
about 40,000 years ago during the paleolithic period, humans started representing their worldly understanding through cave paintings. they depicted large animals, predators, human hunters, i.e., the observable phenomena of their immediate world, rendered in ochre and charcoal on stone surfaces (see Lenssen-Erz 2012).
 click to expand
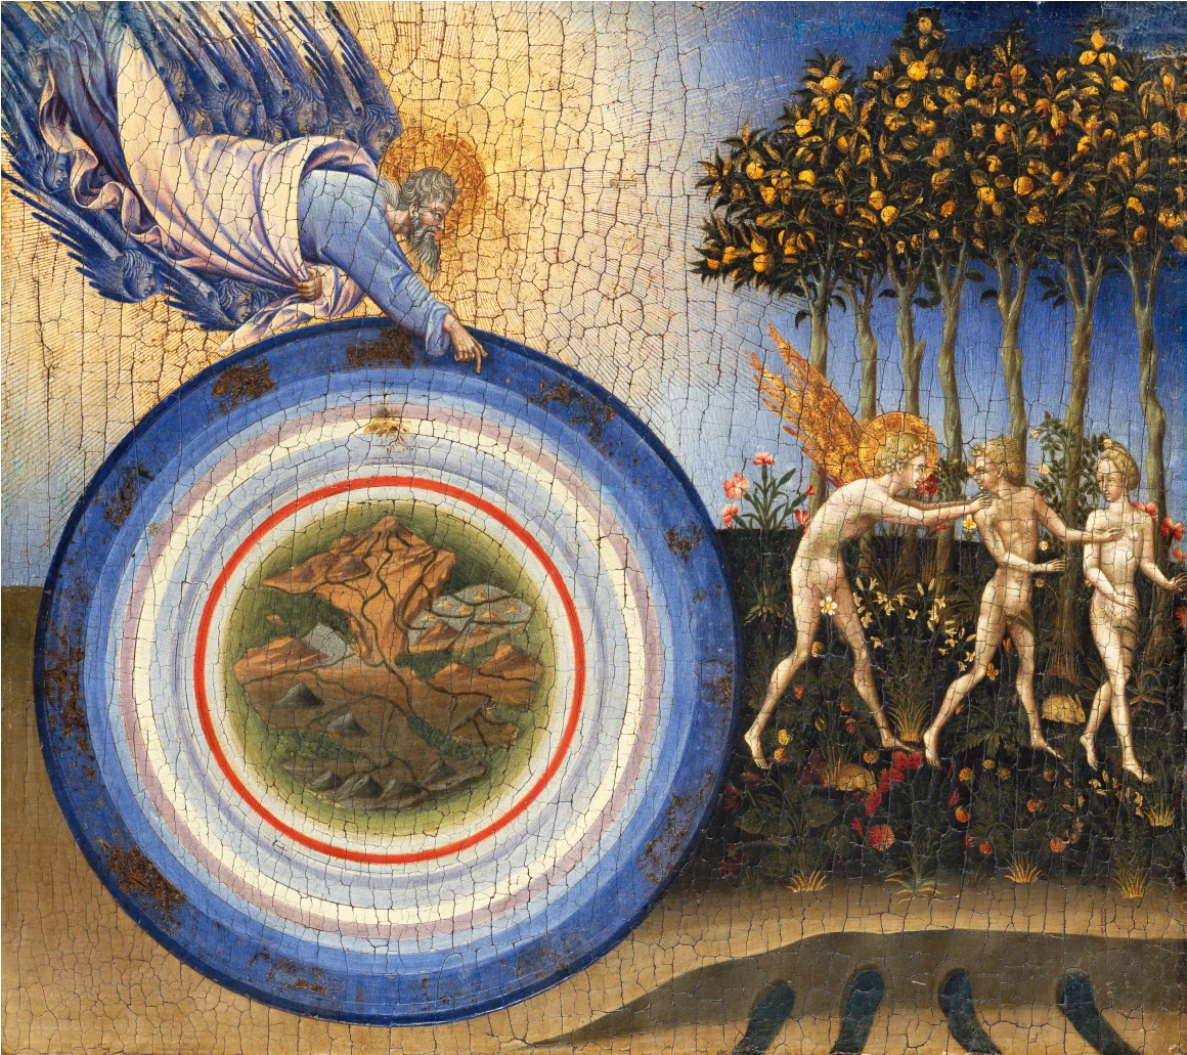
jump forward to the renaissance. Giovanni Di Paolo’s 1445 painting “the creation of the world and the expulsion from paradise” offers a different kind of visualization (see ciobanu and ungureanu 2015). it was not quite direct observation but more of their rather liberal cosmological imagination. nested spheres represent the heavens, earth sits at the center, celestial bodies arrange themselves in concentric orbits. this is a mix of theology and geometry, and all-in-all, a somehwhat pretty attempt to make divine order visible through prevailing artistic technique.
 click to expand
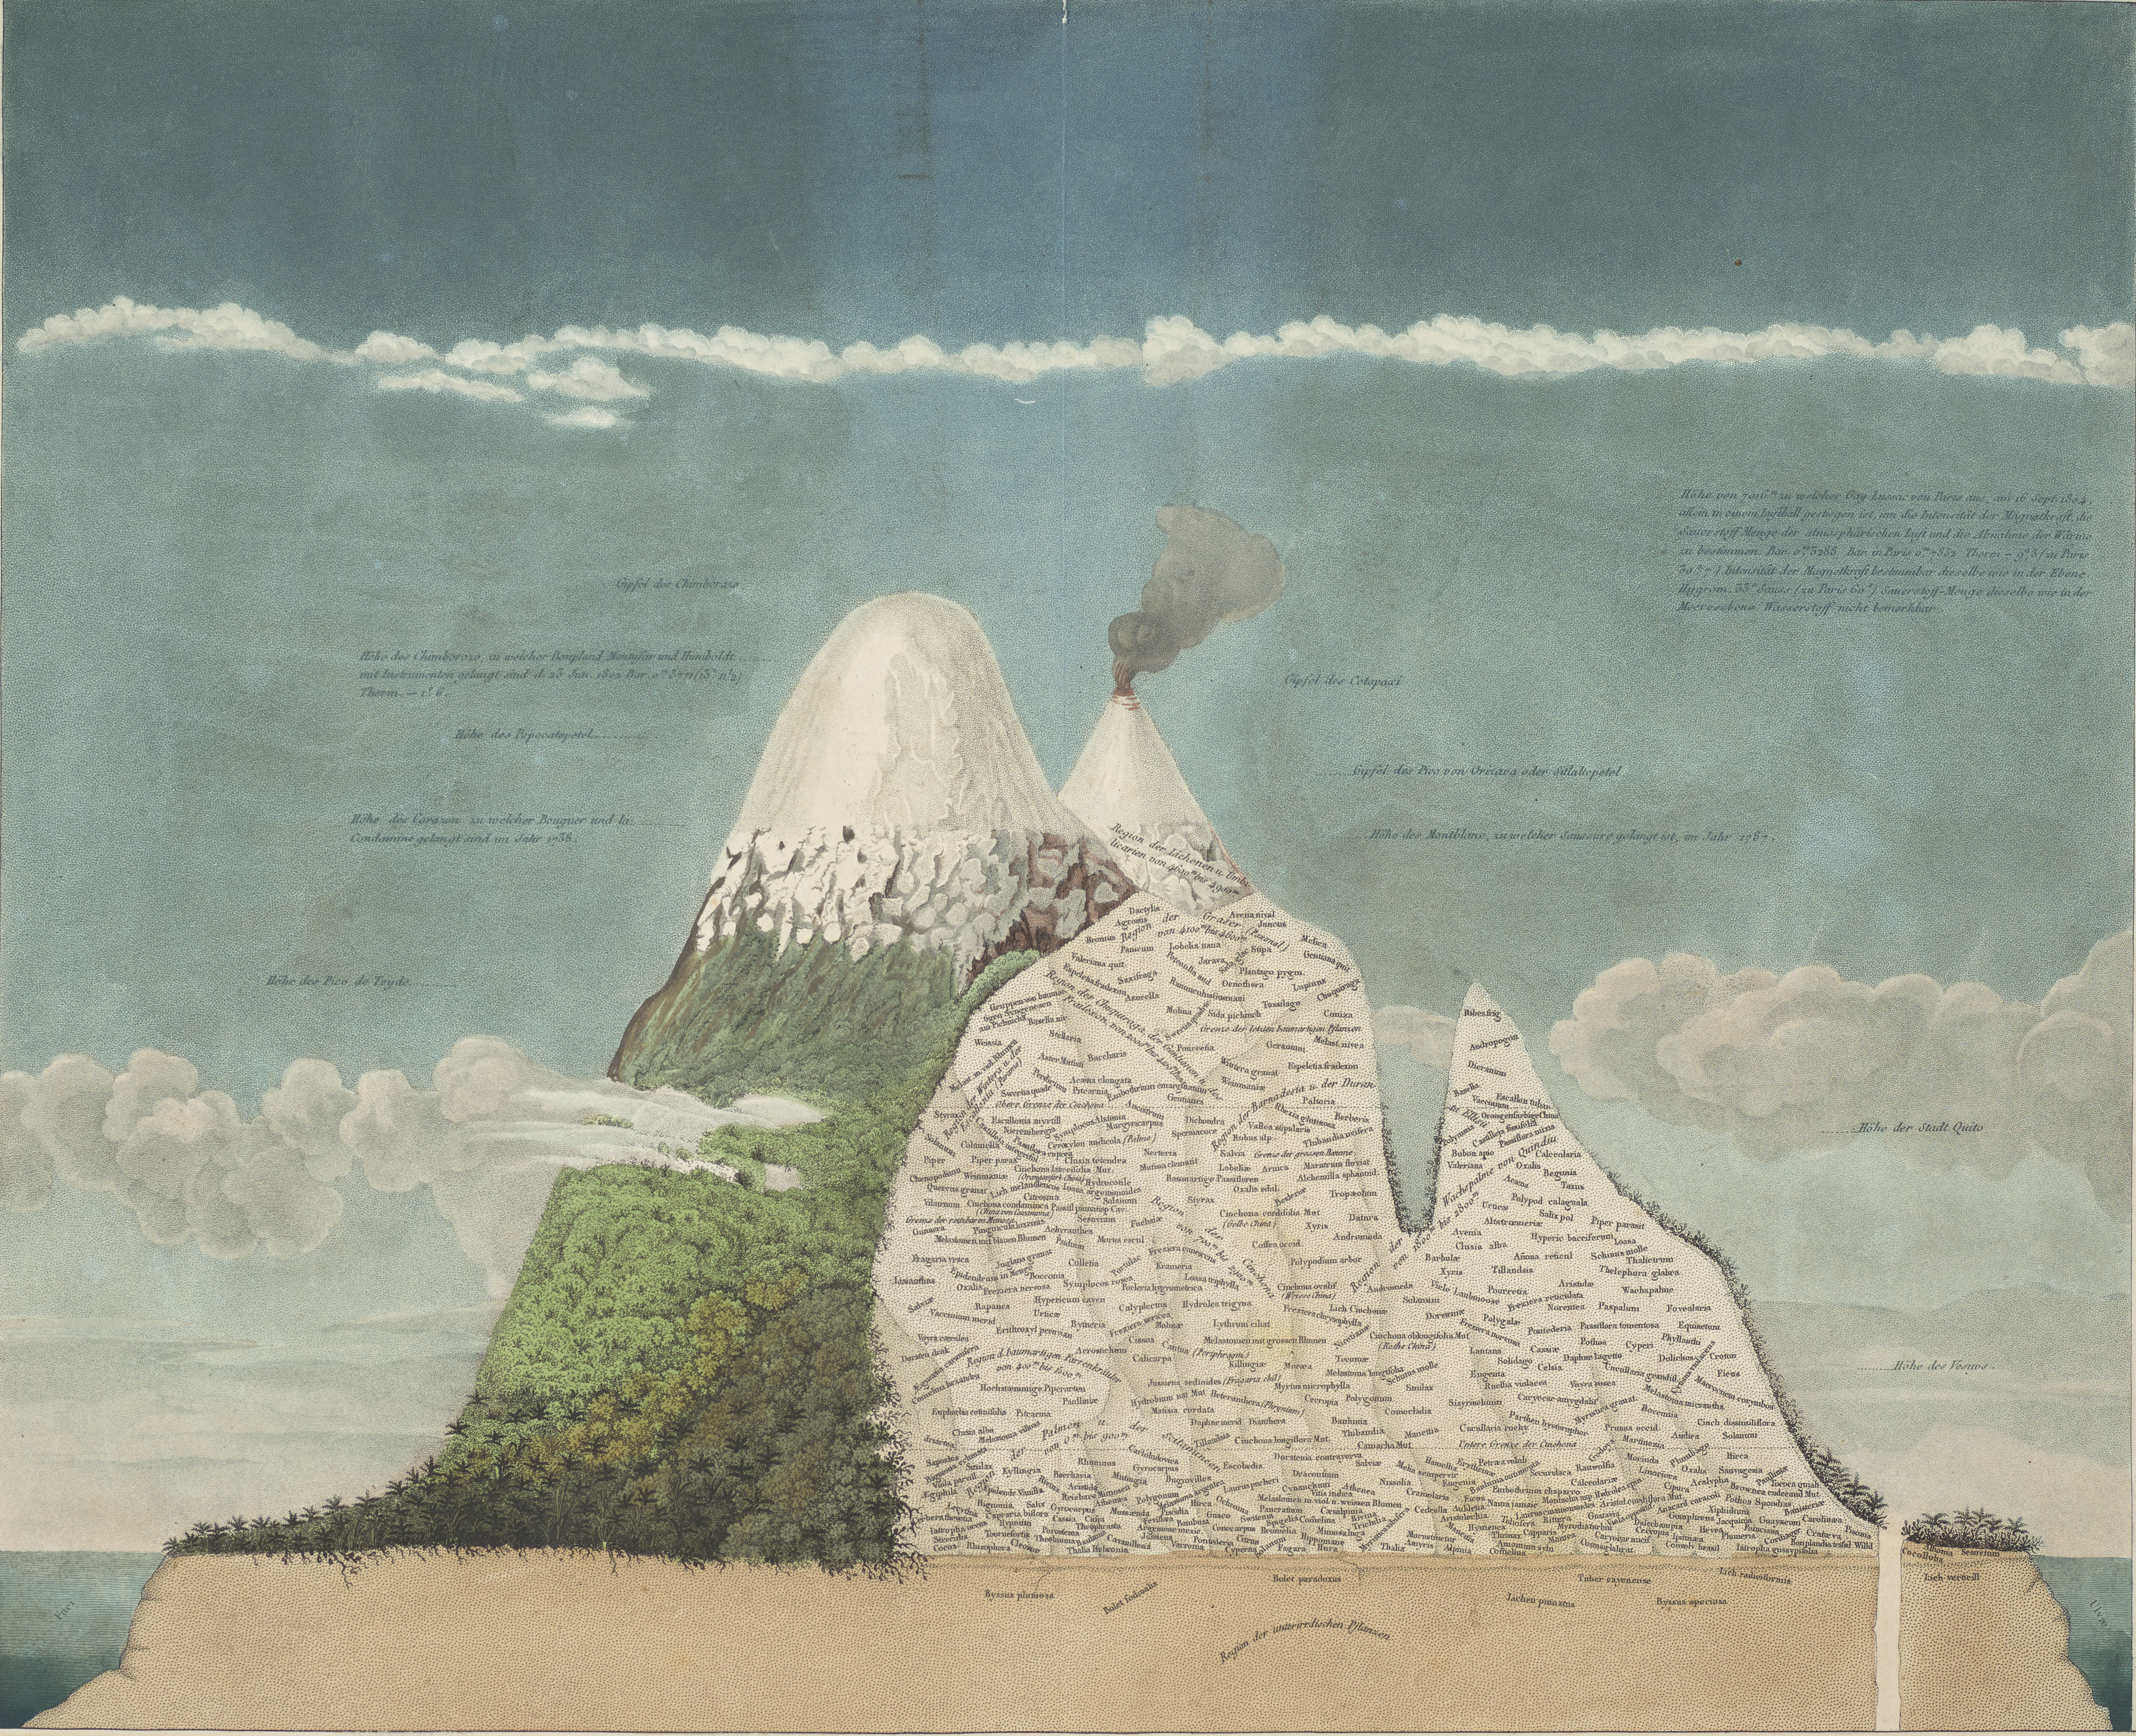
for as long as humans have tried to understand the world, we have relied on images to compress experience and observation into something graspable. in earlier traditions, from ancient observers through medieval scholars and early modern naturalistses-voyageur (Outram 1996, p. 259), phenomena were encountered in place, at human scale, through direct presence and embodied observation. those who witnessed the worlds they explored firsthand translated them into drawings, diagrams, or narrative accounts that then circulated outward, allowing others to know the world at a remove. more recently, in the work of Prussian naturalist Alexander von Humboldt, this impulse took diagrammatic form, where landscapes, climates, flora, and measurement were compressed into single comparative images that attempted to render the totality of experience legible at a glance (figure 3).
 click to expand
even then, most observers were already distant.
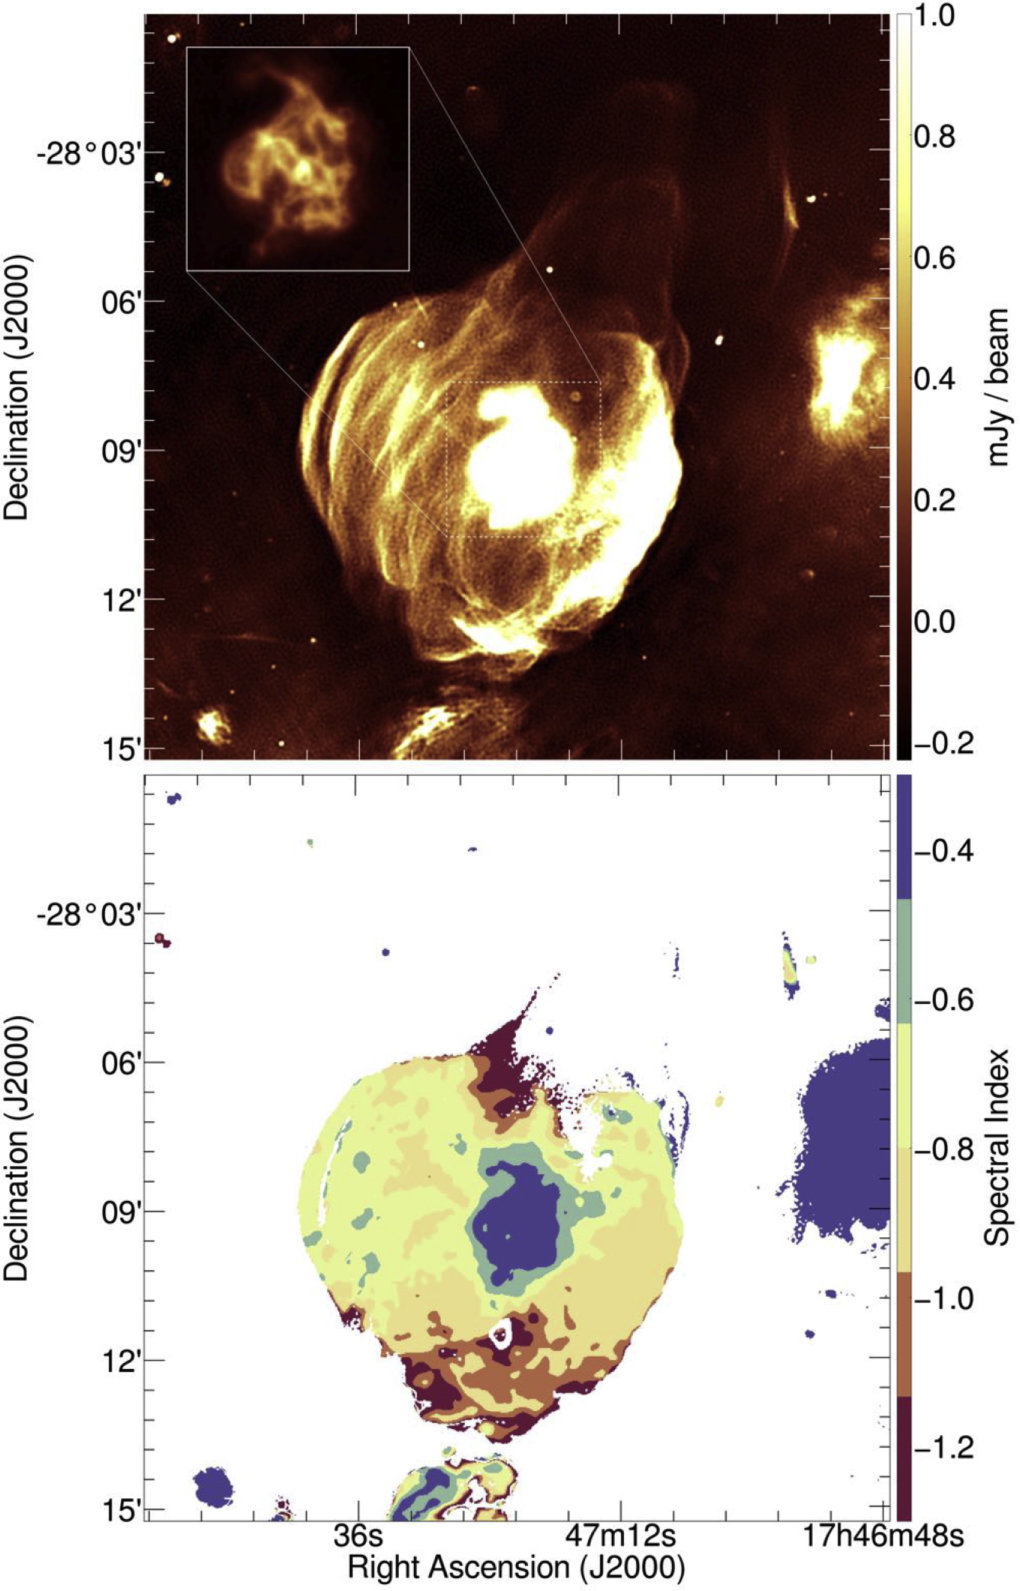
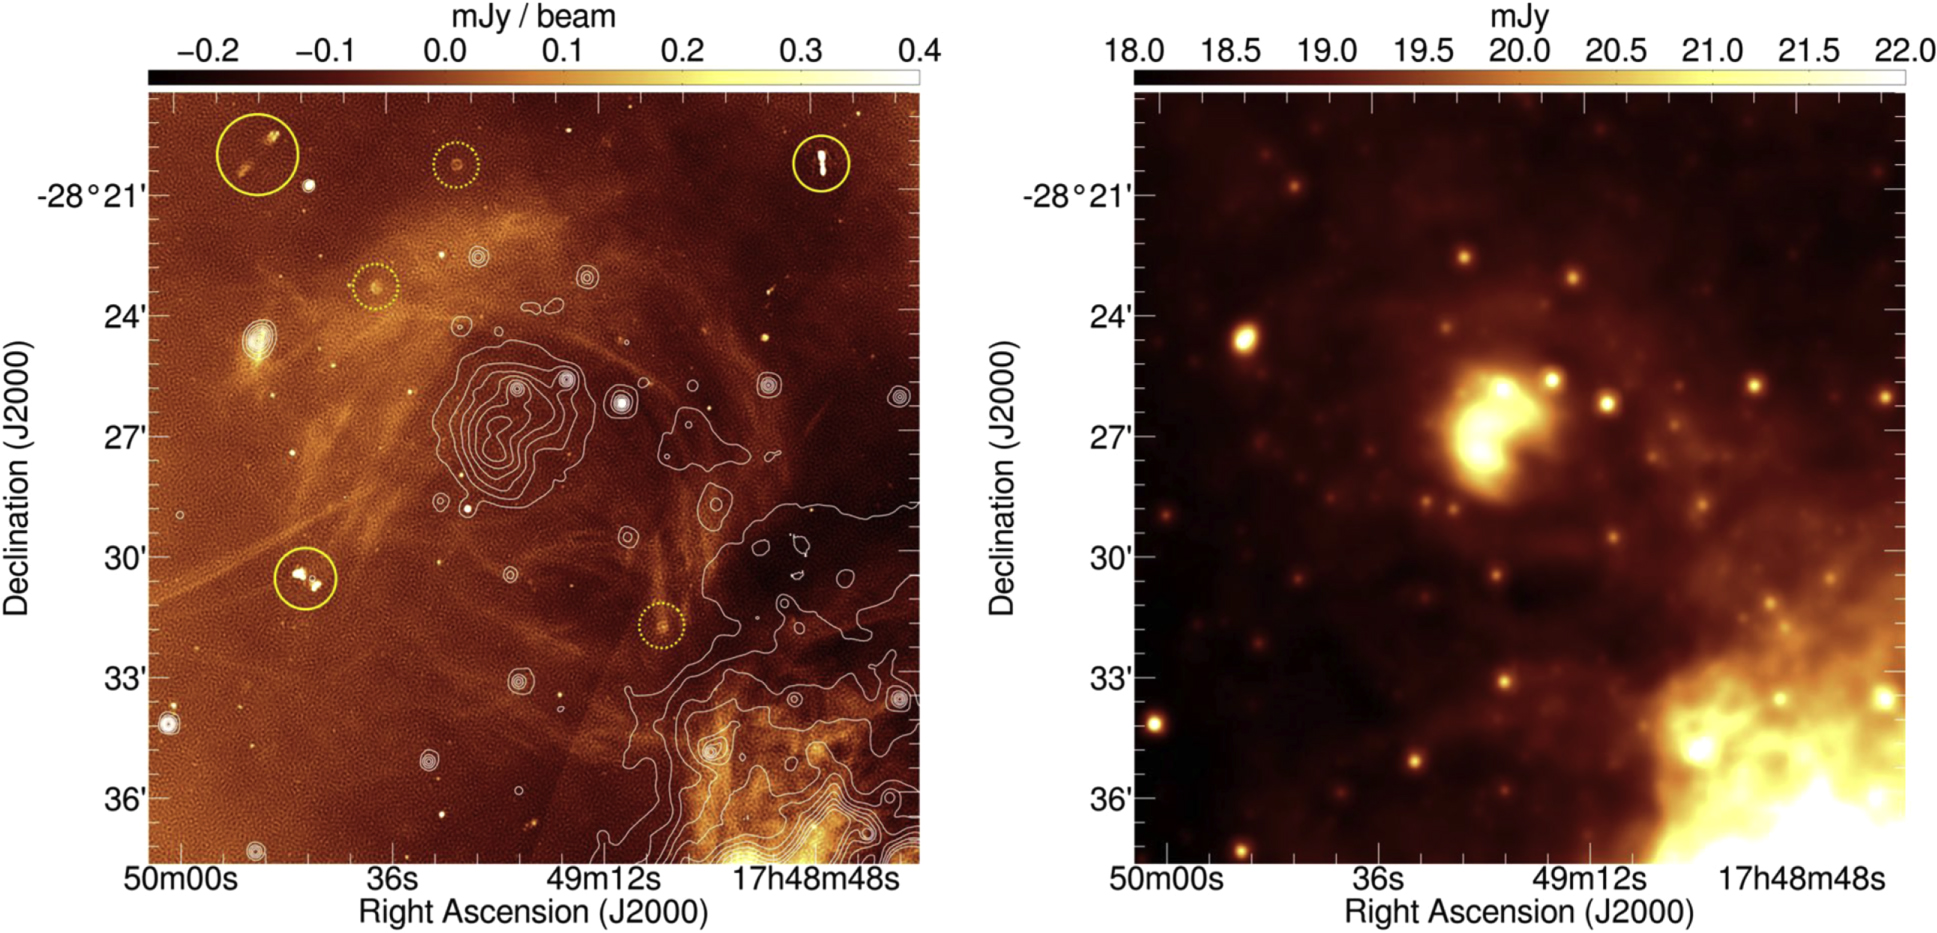
today, that distance has become universal. what we encounter is never the thing itself, but a translation shaped by instruments, their limits, and the belief systems that guide their use. as those instruments extend beyond the human scale, time and distance begin to fold inward. heywood et al. (2022) stitched together one of the most comprehensive visual representations of the center of the milky way galaxy yet, using the meerkat radio telescope. modern astronomers, using bleeding edge technology, have captured for our mortal eyes the unimaginable violence raging at the center of the very galaxy we inhabit. radio waves, which are invisible to the human eye, are translated into false-color images that have exposed magnetic filaments, hidden star-forming regions, and energetic processes occurring ~26,000 light-years away (figure 4).
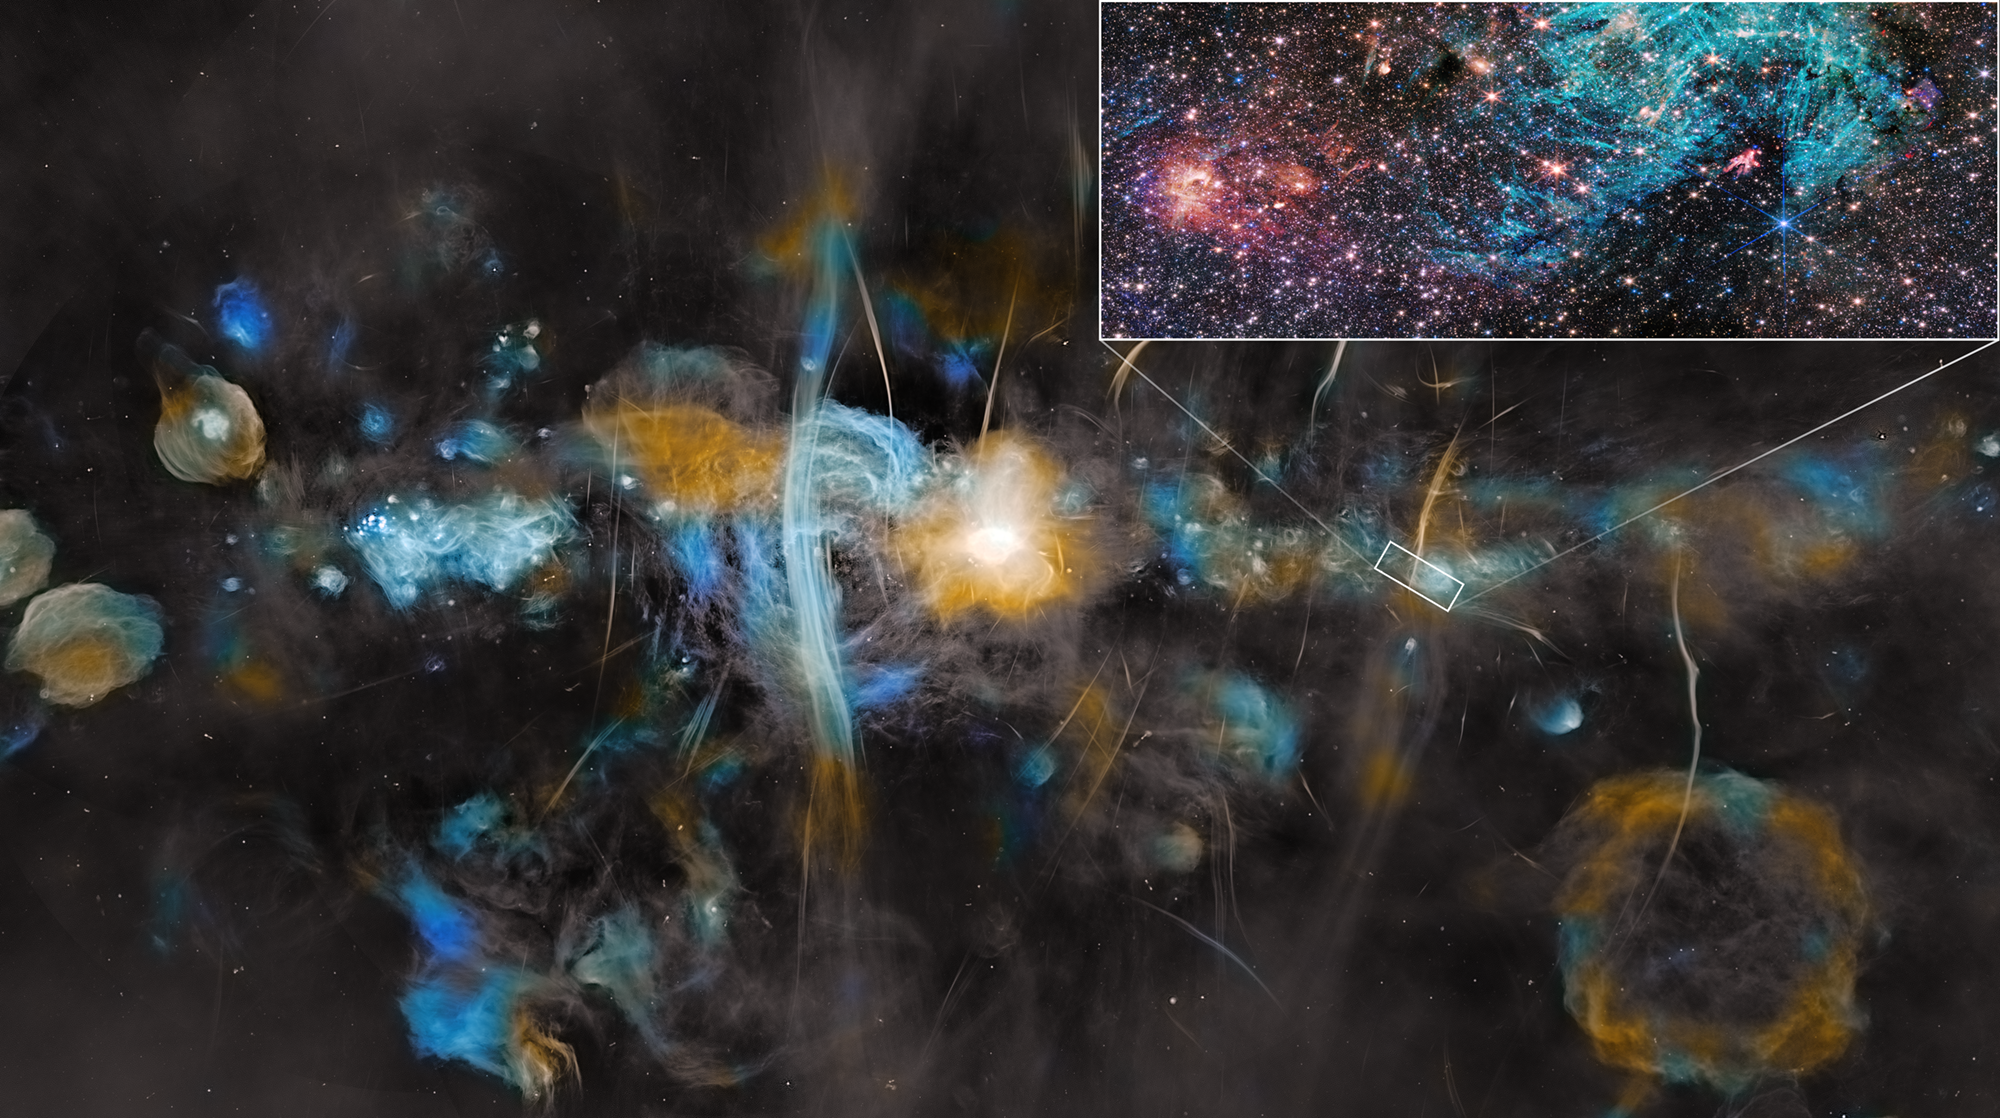
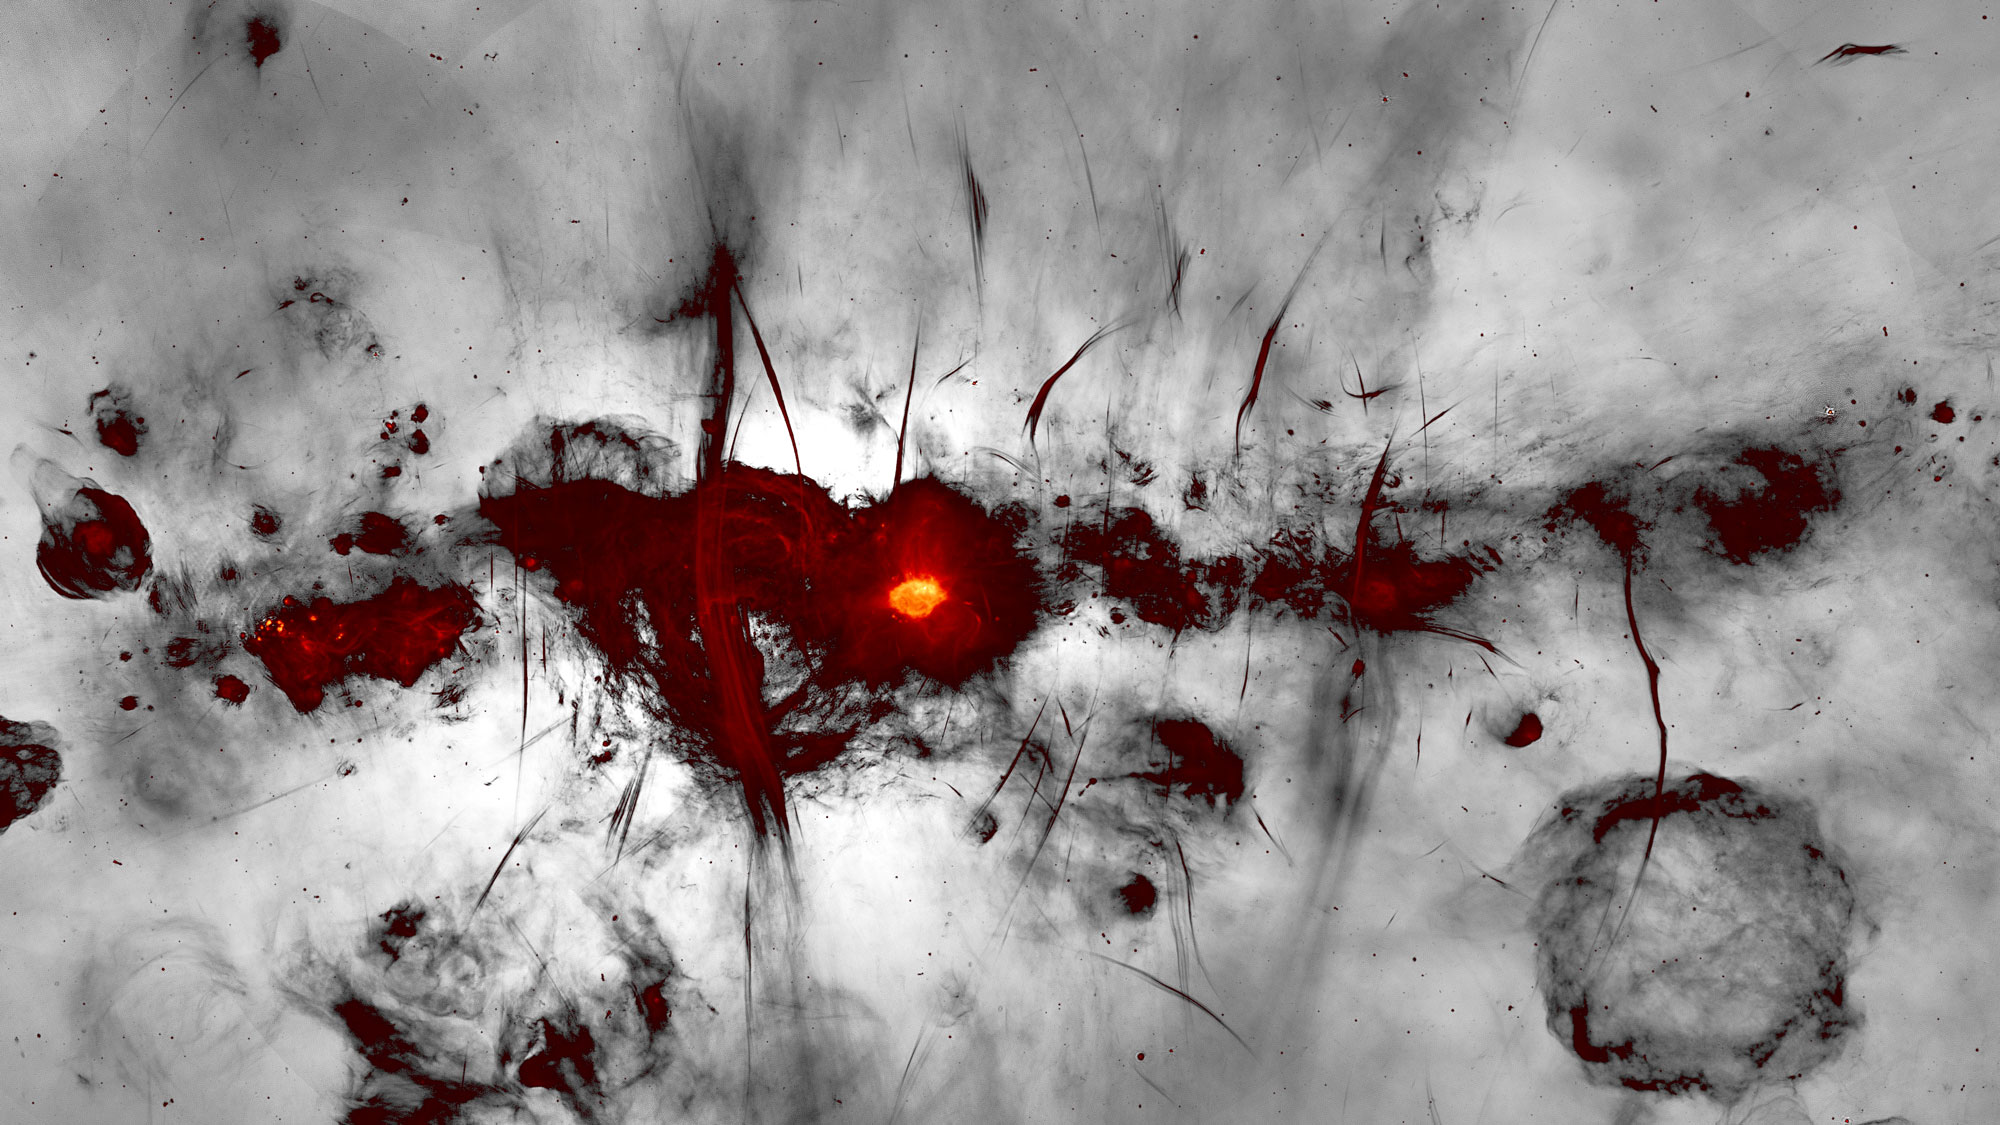
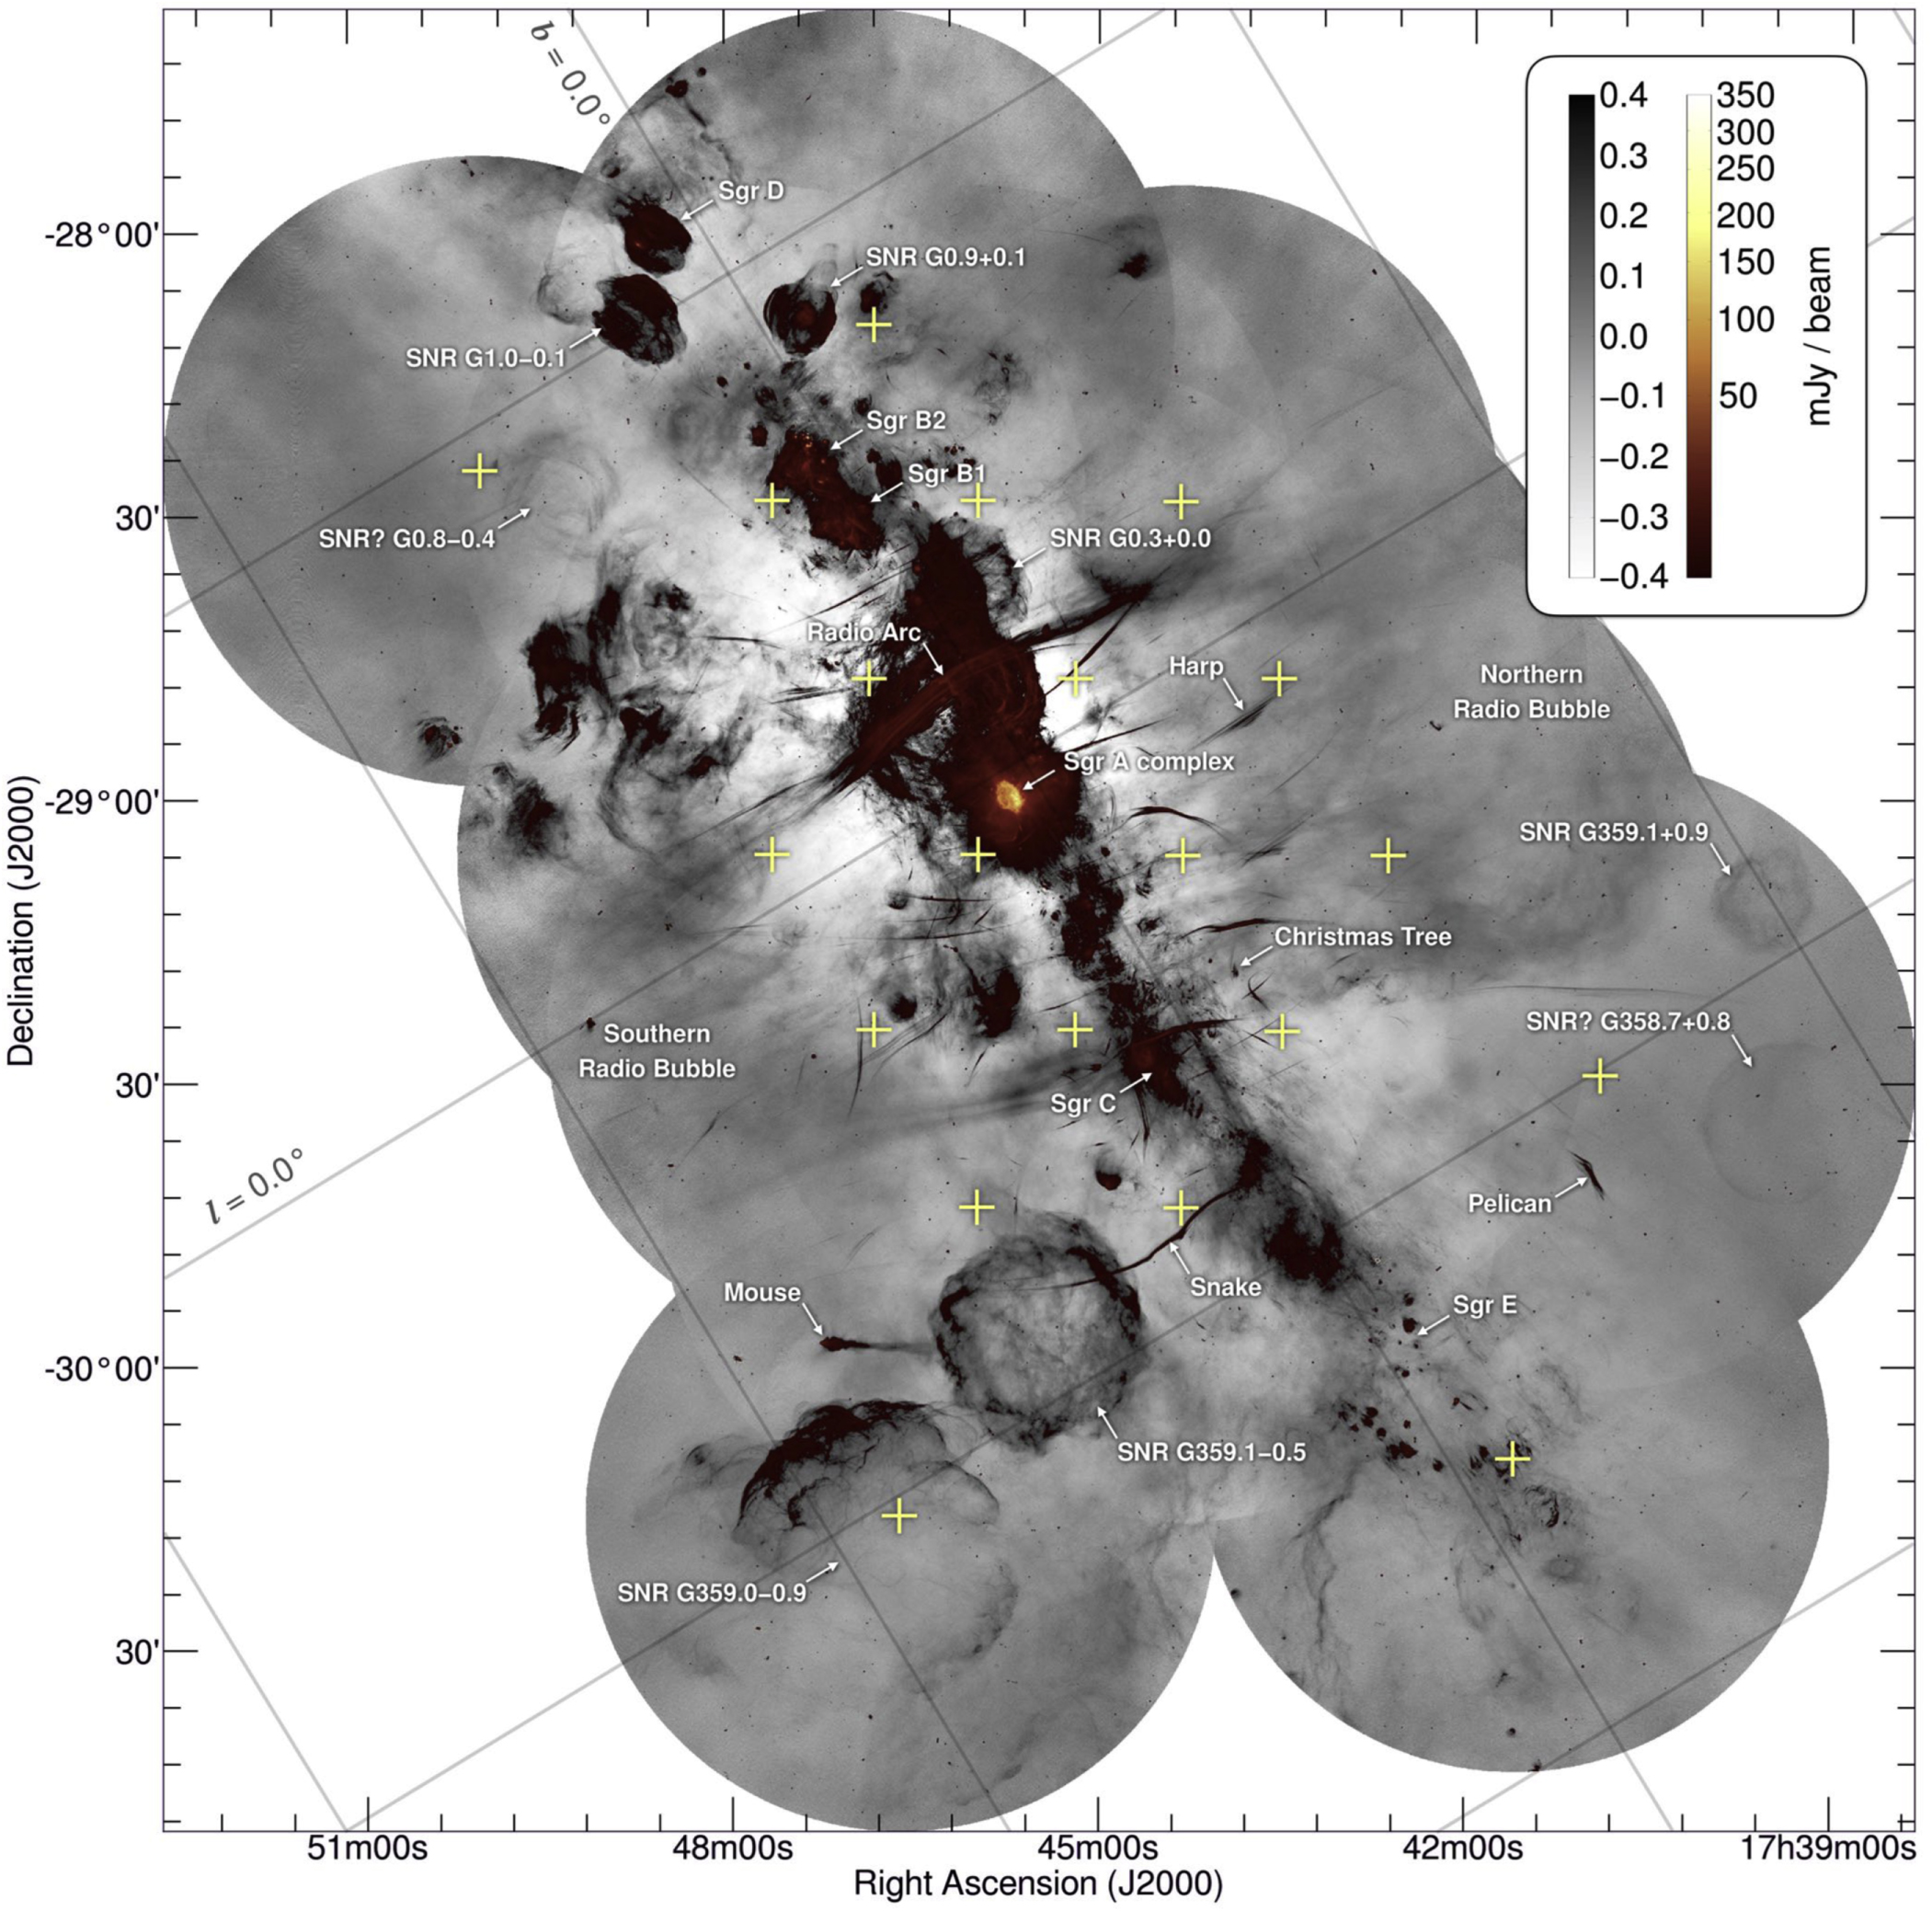
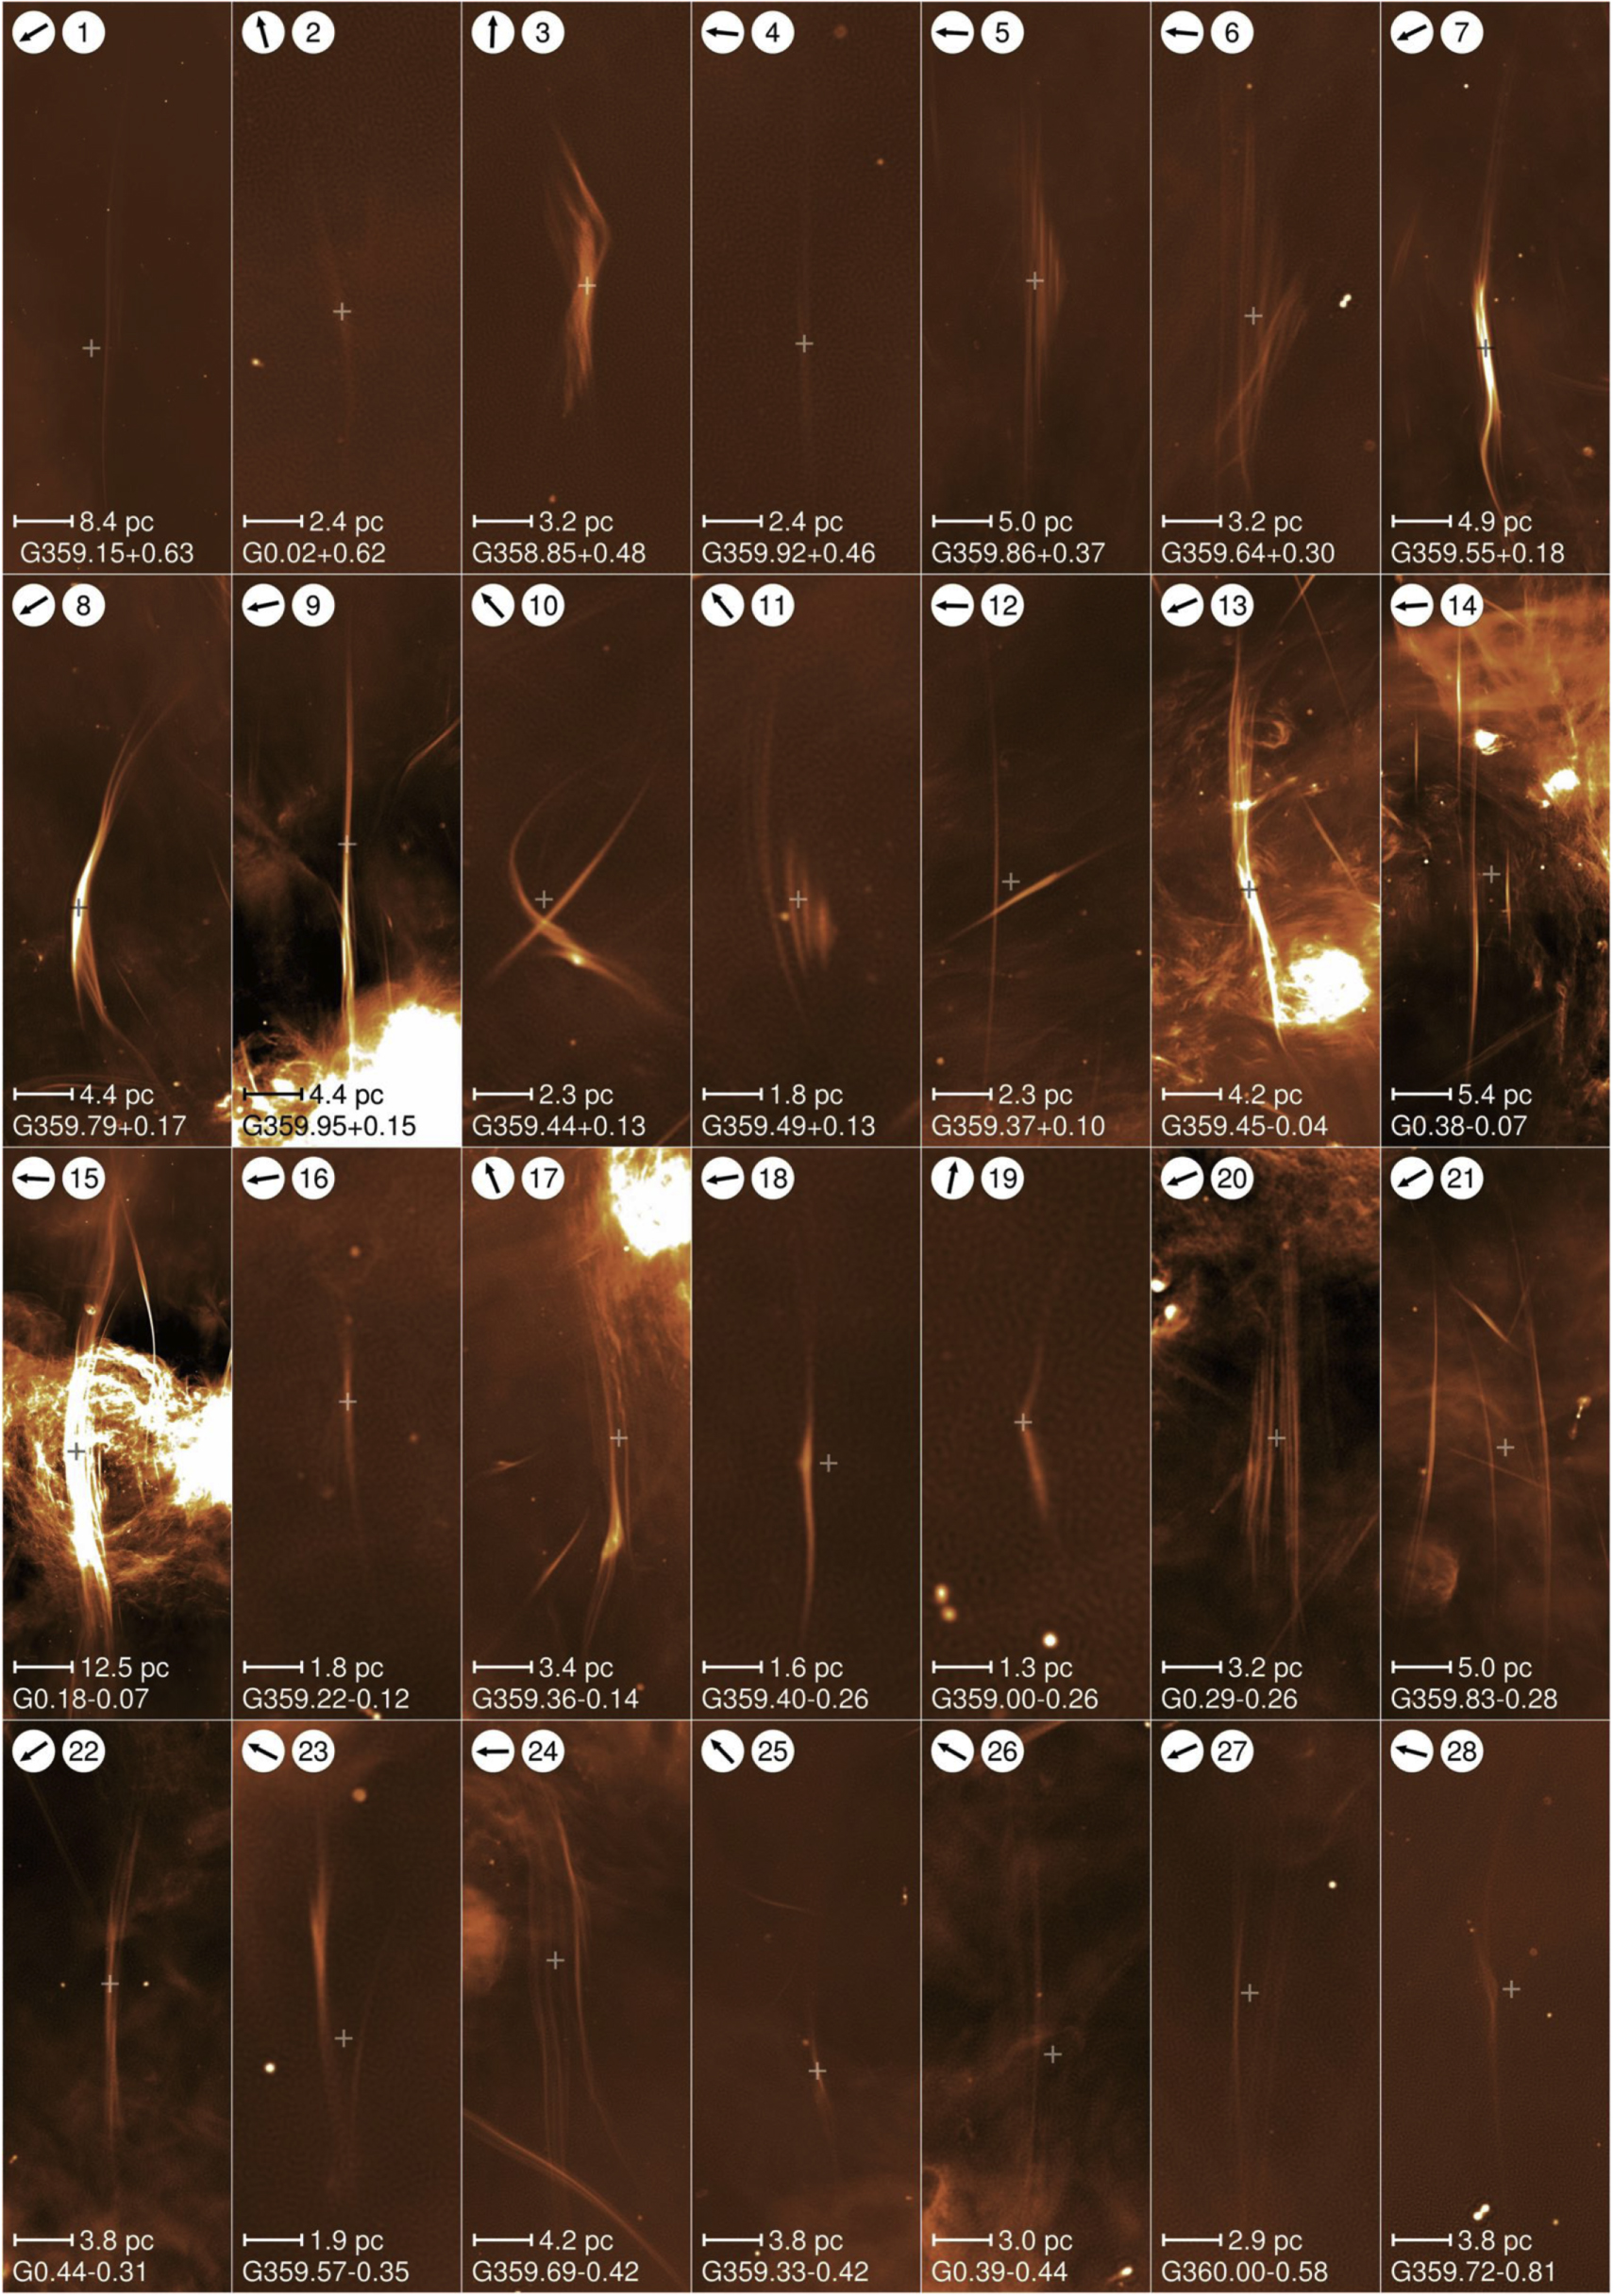
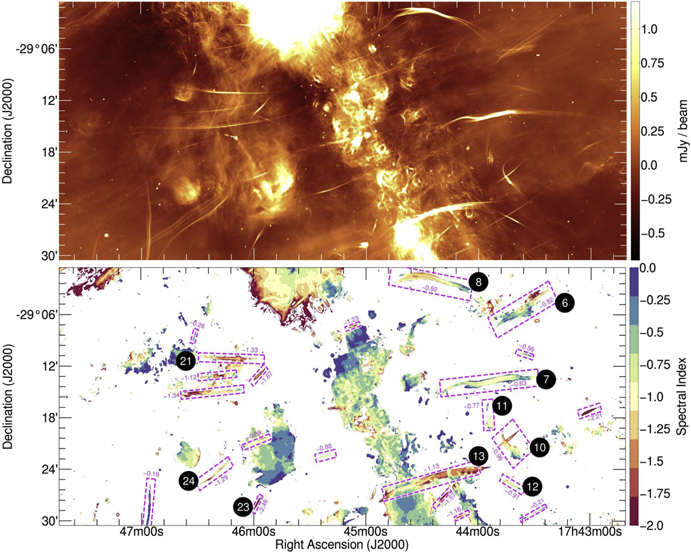
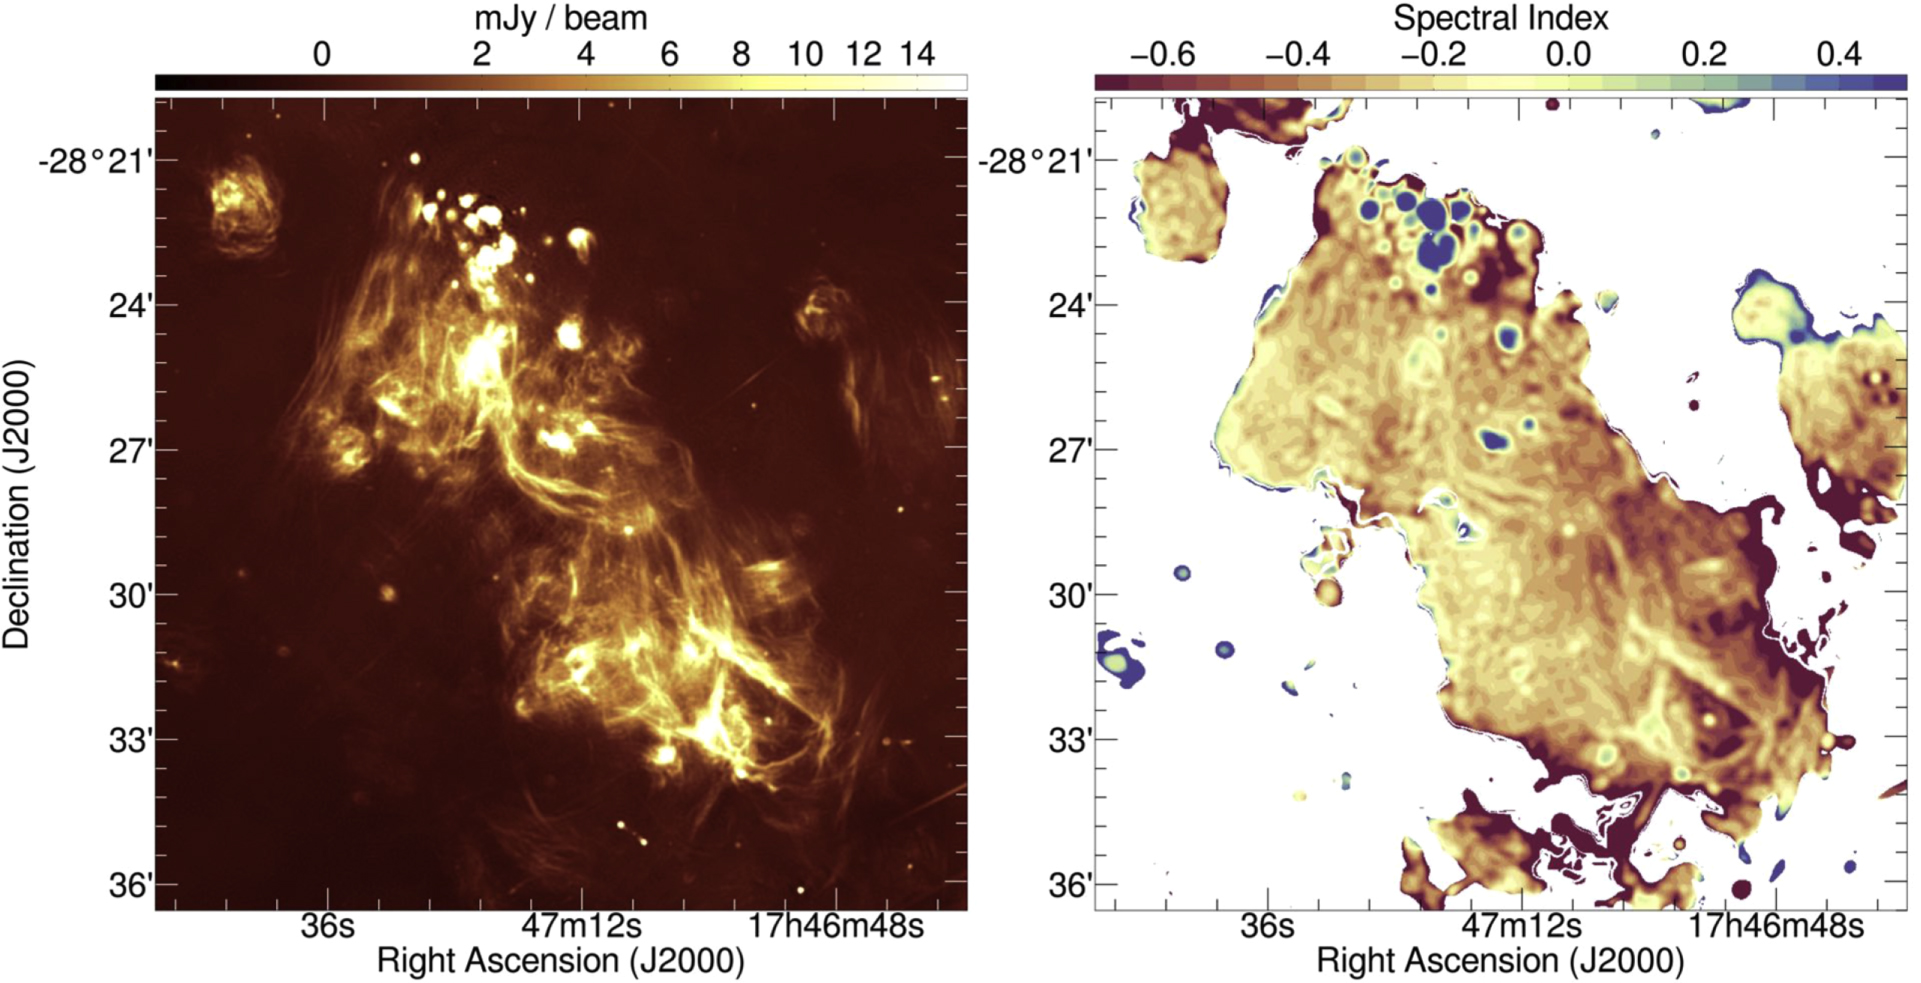
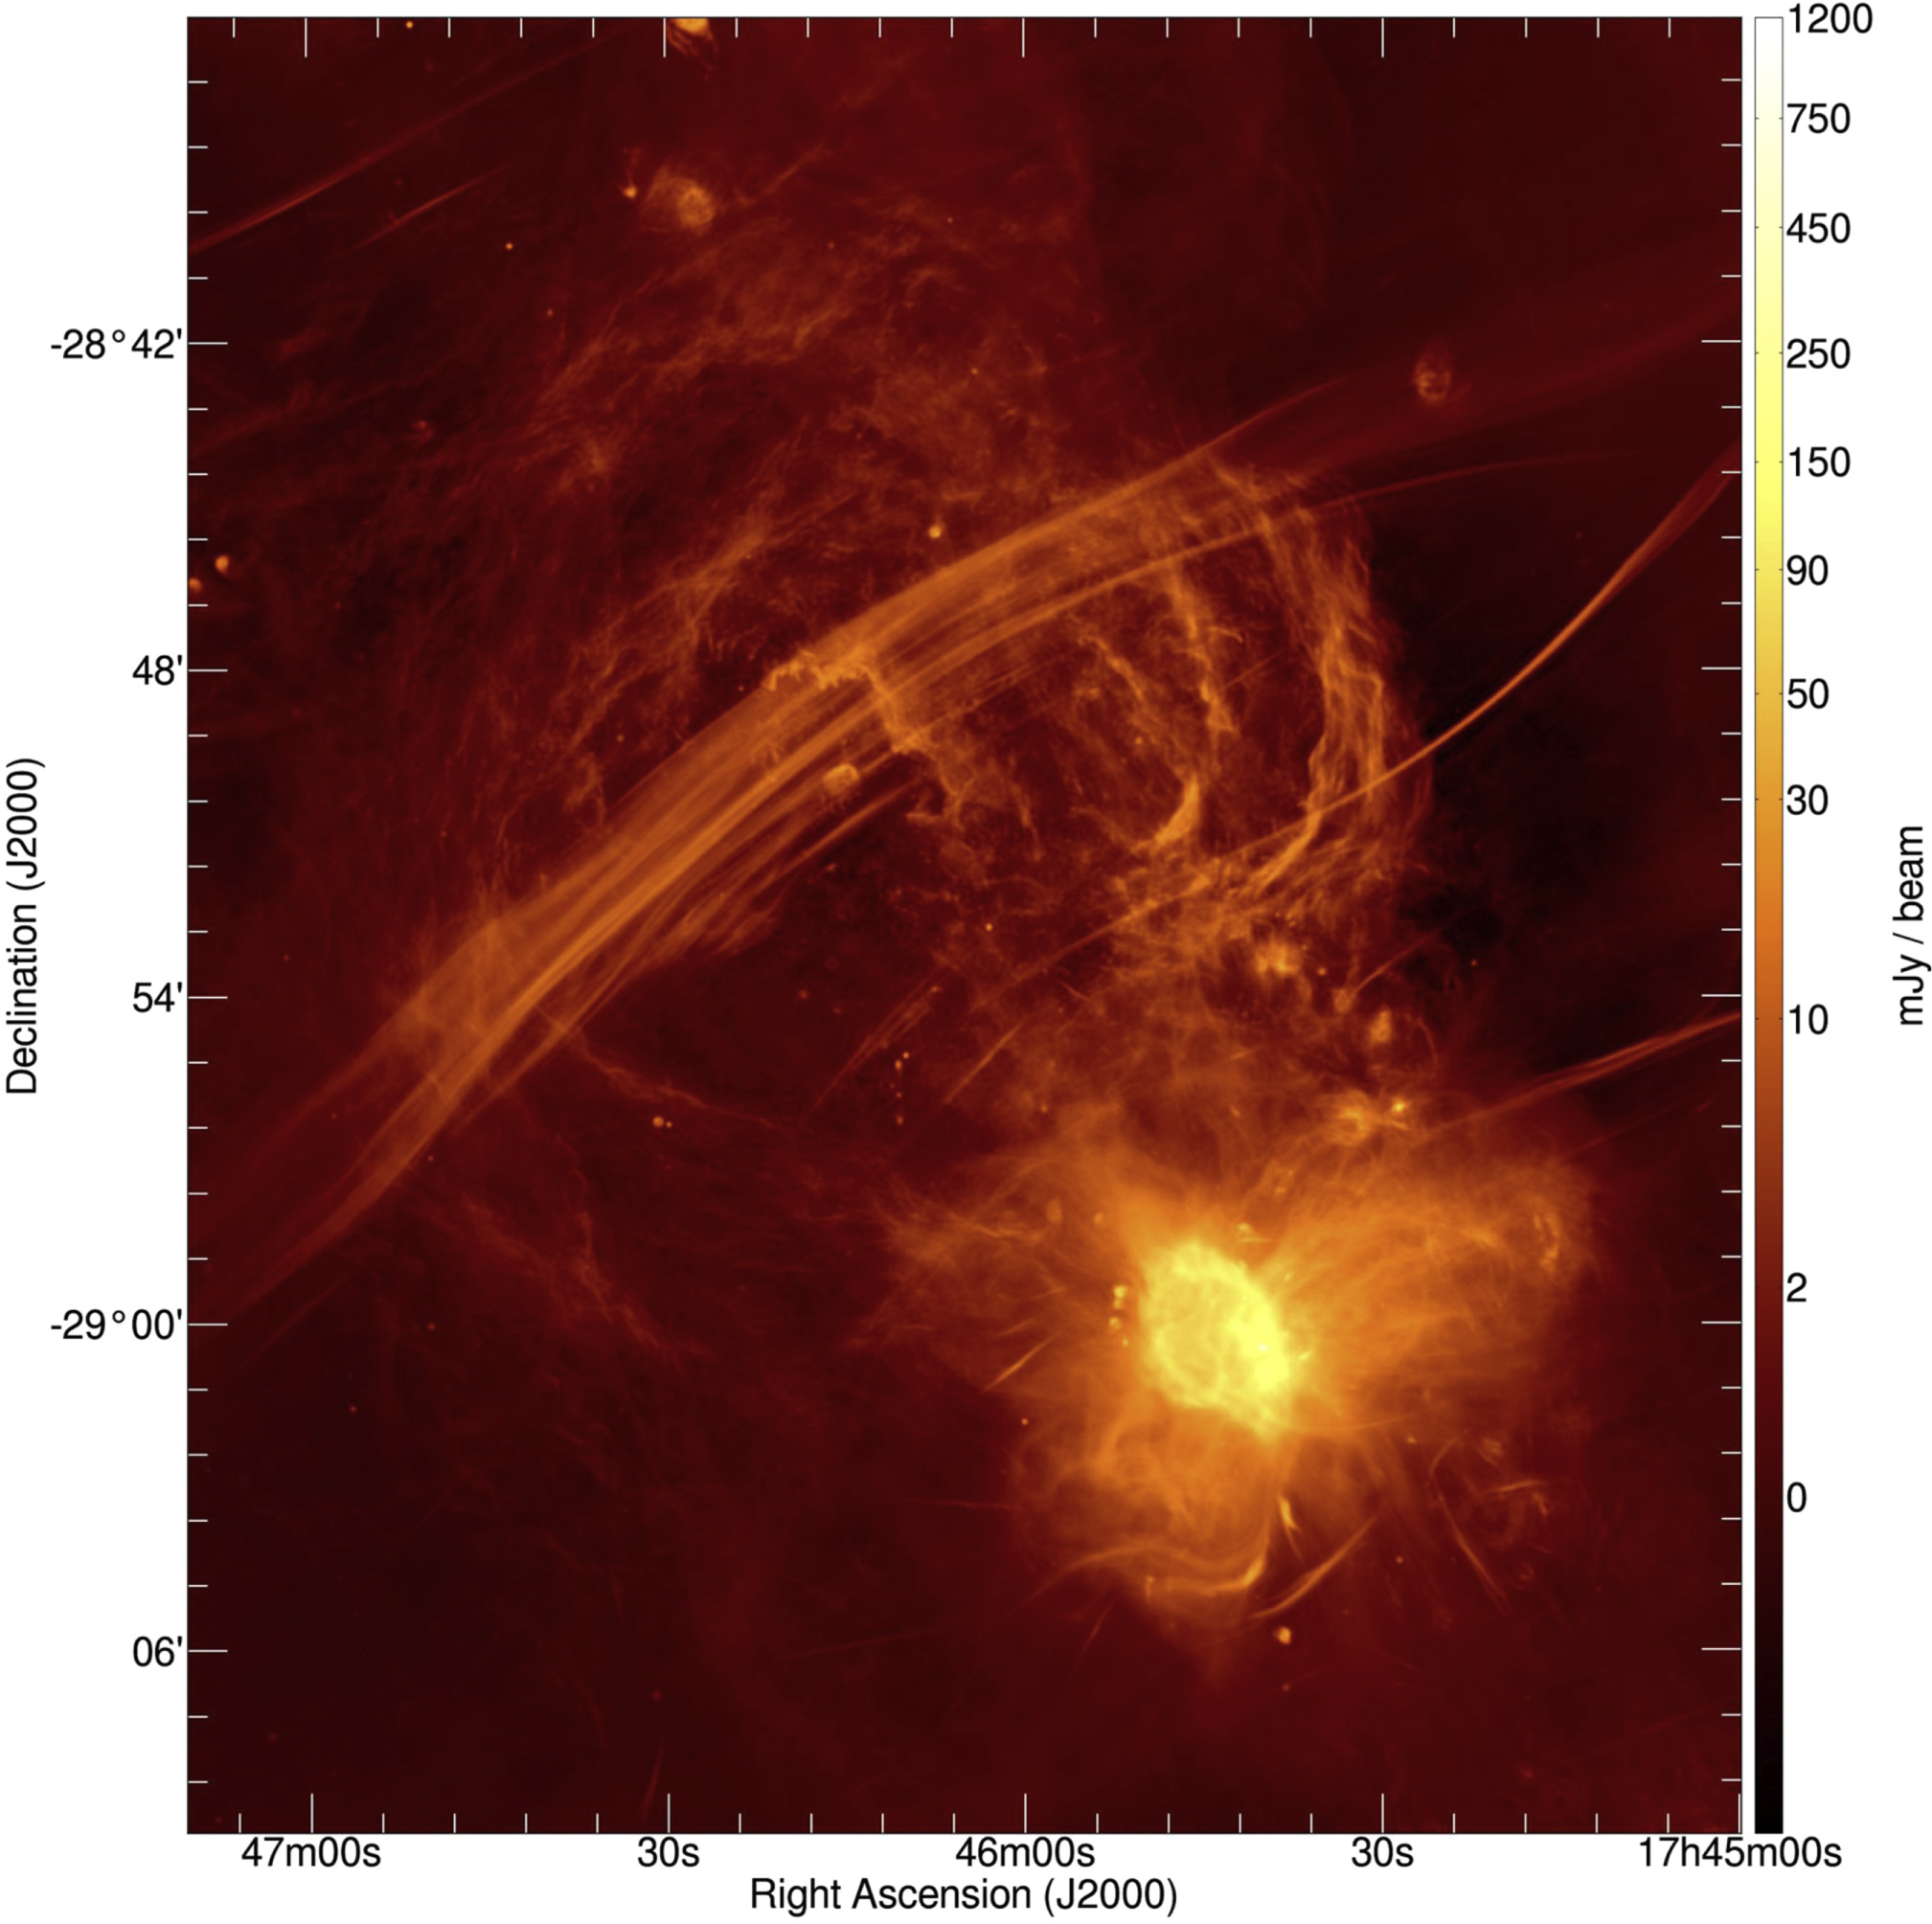
does figure 5 not look like some sort of lovecraftian monstrosity? like elder gods suspended in the vast ocean of space. at the heart of it all is Sagittarius A, four million solar masses packed into a region smaller than our solar system. in the meerkat data it is not a neat point but shows up as a significant disturbance, almost like a wound in spacetime that has been active, then quiet, then active again across millions of years. it almost looks like the eye of a space cyclops.
these are, on the one hand, epistemological questions, and on the other, aesthetic. and they connect directly to bruno latour’s influential work on visualization and scientific knowledge production.
immutable mobiles and the problem of the galaxy
when the gaia space telescope released its third data catalog in June 2022, it gave us coordinates for nearly two billion stars. but nobody looks at spreadsheets of stellar positions (other than highly trained professionals, of course). instead, the majority of us encounter the milky way through beautifully rendered images: three-dimensional fly-throughs, false-color composites, rotating galactic models that translate photometric data into something recognizable as our galaxy.
these images raise a question central to latour’s 1986 essay “visualisation and cognition” (latour 1986). how does scientific knowledge become mobile, stable, and combinable enough to accumulate at centres of calculation?
the milky way, or rather, any attempts at apprehending the cosmos, presents a peculiar problem for latour’s framework. we cannot stand outside it to observe it directly, nor can we make in-situ sketches like the adventure naturalists of the colonial period. every visualization of our galaxy is therefore a theoretical reconstruction, one that enables scientists to isolate particular aspects of cosmic phenomena, make patterns legible, and generate questions that incrementally extend our understanding of what remains fundamentally unobservable.
unlike the botanical specimens or geological samples latour describes being transported to metropolitan laboratories, the milky way never physically arrives anywhere. for latour, however, it was not only samples that mattered. field notes, drawings, diagrams, and scientific papers were also immutable mobiles, objects that could travel, be compared, and be worked on at a distance. during the colonial period, producing and circulating these materials took time. observations were recorded in situ, refined through drawing or writing, and only gradually reached centers of calculation. in contemporary astronomy, that delay has largely collapsed. observational data from the galaxy is collected and transmitted almost instantly, yet it still cannot be encountered directly. photon counts, spectroscopic signals, and other measurements must be processed and translated before they take visual form. what reaches us is therefore not the milky way itself, but a continuously updated representation shaped by instruments and computation.
earlier modes of representation, from paleolithic cave paintings to medieval cosmological images such as di paolo’s, were shaped by belief systems and conventions, but their referents existed at human scale and could be apprehended in principle. whether through direct encounter with animals or through inherited theological and aristotelian models of the cosmos, these images translated ways of seeing that were already culturally familiar. humboldt’s diagrams marked a shift away from a single visible viewpoint, combining many observations into portable visual summaries that allowed scientific knowledge to travel beyond the place where it was gathered. contemporary astronomical visualization goes further still. the meerkat image does not show a view anyone could ever see, since the galactic center cannot be observed directly in this form. instead, it is built from measurements collected by instruments, with color added to represent different kinds of data rather than actual appearance.
visualization as construction
this marks a qualitative break in the history of scientific images, in which visualization shifts from representing an external referent to actively constructing the visual object of knowledge, a move that complicates latour’s notion of immutable mobiles. in latour’s original formulation, images and inscriptions gain power by stabilizing objects so they can circulate unchanged across space and institutions (latour 1986). in contemporary astronomy, however, the object itself only achieves provisional stability through visualization. the galactic center does not simply travel as an image. it is iteratively assembled through models, calibration choices, rendering pipelines, and interpretive conventions. each visualization participates in defining what the object is understood to be at a given moment.
this situation aligns with, but also extends, longstanding debates about objectivity and interpretation in scientific imaging. Lorraine daston and peter galison have shown that scientific images have never been neutral windows onto nature, but have always reflected epistemic virtues such as truth to nature, mechanical objectivity, or trained judgment (daston and galison 2007). recent work on data intensive and computational science suggests that visualization now operates under a different regime. as scholars such as johanna drucker and lev manovich argue, visualizations increasingly function as interfaces rather than representations, shaping interpretation by structuring how data can be seen and manipulated (drucker 2011; manovich 2012). in this context, choices about color scales, thresholds, and compositing are not secondary aesthetic decisions but central epistemic acts that determine which features of the data emerge as meaningful.
seen across deep time, the history from paleolithic cave painting to radio astronomy is therefore not a simple story of increasing visual accuracy or technological progress. it is a history of changing relationships between observers, instruments, and the worlds they seek to know. images have always helped humans think beyond the limits of direct experience, but in the age of algorithmic science they have become indispensable sites where knowledge is actively made. the cosmos we encounter today exists for us primarily through these visual constructions. rather than revealing a preexisting universe in ever sharper detail, contemporary astronomical images define the very conditions under which the universe becomes intelligible at all.
this article draws on ongoing work examining the relationship between historical and contemporary scientific visualization practices.
references
- ciobanu, gabriel, and cristian ungureanu. 2015. “visible and invisible structures in renaissance paintings.” materials today: proceedings 2 (6): 3884–3888. https://doi.org/10.1016/j.matpr.2015.08.016.
- latour, bruno. 1986. “visualisation and cognition: thinking with eyes and hands.” knowledge and society 6: 1–40.
- lenssen-erz, tilman. 2012. “pastoralist appropriation of landscape by means of rock art in ennedi highlands, chad.” afrique : archéologie & arts 8 (2012): 27–43. https://doi.org/10.4000/aaa.414.
- daston, lorraine, and peter galison. 2007. objectivity. new york: zone books.
- drucker, johanna. 2011. “humanities approaches to graphical display.” digital humanities quarterly 5 (1).
- heywood, ian, i. rammala, f. camilo, w. d. cotton, f. yusef-zadeh, t. d. abbott, r. m. adam, g. adams, m. a. aldera, k. m. b. asad, et al. 2022. “the 1.28 GHz meerkat galactic center mosaic.” the astrophysical journal 925 (2): 165. https://doi.org/10.3847/1538-4357/ac449a.
- manovich, lev. 2012. “what is visualization?” visual studies 27 (1): 36–49.
- outram, dorinda. 1996. “new spaces in natural history.” in cultures of natural history, ed. nicholas jardine, james secord, and emma spary, 249–265. cambridge university press.